When designing a relational database, engineers create an entity-relationship diagram to represent how different pieces of data are related. These diagrams provide a clear visualization of data relationships, making it easier to understand the overall structure.
ERD allows stakeholders to verify if an information system design aligns with business requirements before it gets into development. It also allows developers to create relational databases that complement data storage needs.
An entity-relationship diagram (ERD) is a flowchart that represents how different entities are related to each other in a database. These diagrams help design databases or troubleshoot issues in relational databases.
The entities can be people, objects, or causes. They’re represented on an ERD using different shapes, such as ovals, rectangles, or diamonds, and connecting lines that illustrate different relationships and their key attributes.
Engineers and database architects often combine ERD with data structure diagrams (DSD). While ERDs focus on the relationships between entities, DSDs highlight the relationships between different elements of entities, helping to describe the informational flow.
Imagine you're building a complex e-commerce platform where customers can browse products, add them to a cart, and make purchases.
Behind the scenes, a well-structured database table ensures all data—from customer details to product inventory—is organized and easily accessible. ERD visualizes the relationships between different data entities, making database design smoother and more efficient.
Using ER diagrams ensures that developers and database designers can:Entities, relationships, attributes, and cardinality are the major components of an ERD data flow diagram.
An entity is anything that can have data stored about it. Simply put, it’s that which you can define – for example, an object, a person, or a concept. It’s a noun represented in a rectangular shape.
┌────────────┐
│ Entity │
└────────────┘
An entity type is a group of definable things. Similarly, an entity set is the same as an entity type but defined at a particular time. For example, “customers” is an entity type, and “customers who signed in yesterday” is an entity set.
Entities can be categorized into three main types:
When an attribute uniquely defines an entity within an entity set, it’s called an entity key. They are of three types. If one or more attributes define an entity in an entity set, it’s a super key. When a database designer uniquely chooses a key to represent an entity within a set, it’s the primary key. Lastly, foreign keys identify relationships between different entities.
Relationships are verbs that represent how entities are linked. For example, in the sentence “Sarah will pay through her phone,” the entities “Sarah” and “Phone,” are connected by the act of paying.
________
/ \
/ \
| REL |
\ /
\_______/
In an ERD, relationships are often represented as diamonds or labels on connecting lines. Sometimes, you might come across a recursive relationship where the same entity participates in a relationship more than once.
Attributes are often represented in an oval or a circle. They can be quality, property, or characteristic of an entity. When an attribute describes the property or characteristics of a relationship, it’s known as a descriptive attribute.
________
/ \
| Attribute |
\________/
There are different categories of attributes:
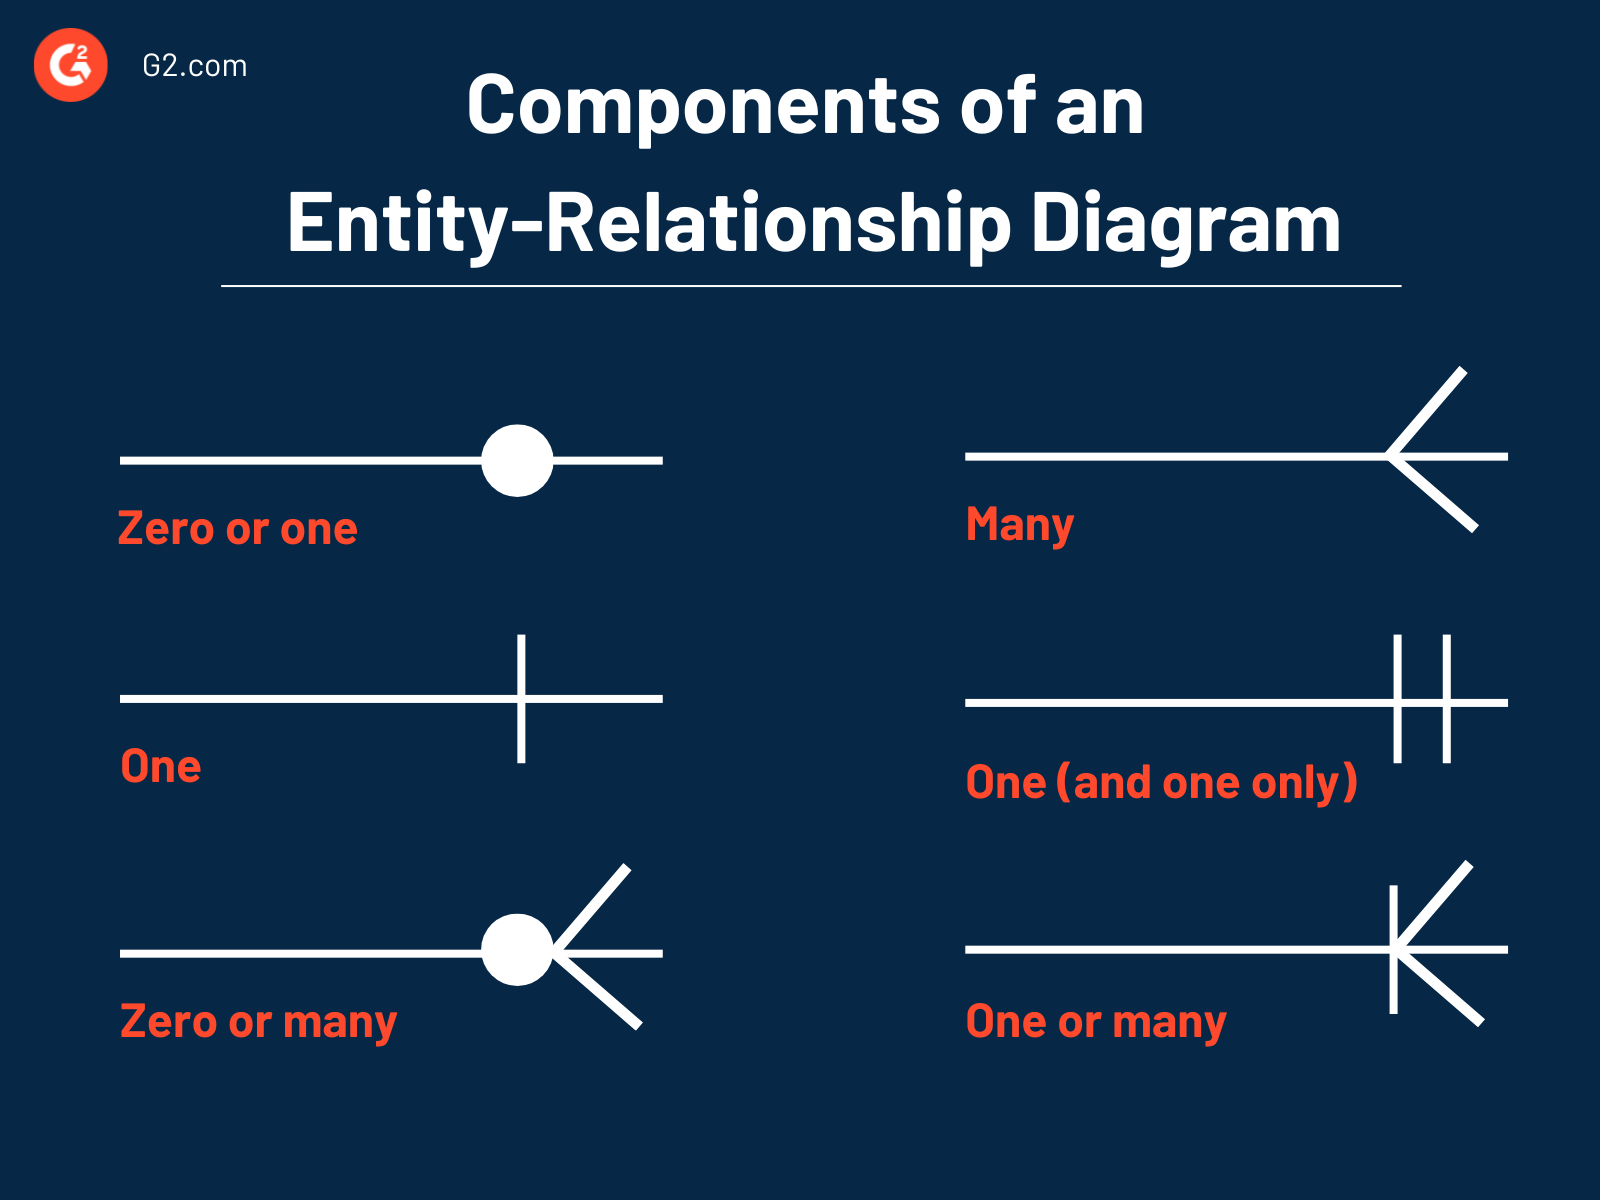
Cardinality describes the number of relationships or instances between entities. It’s usually expressed as a ratio in symbols called crow's foot, which can be one-to-one or one-to-many.
A one-to-one relationship exists between a teacher and their mailing address. Similarly, you’ll see a one-to-many relationship between students and their subjects, which can also be viewed as a many-to-one relationship, as subjects have a single line back to the student.
Lastly, many-to-many relationships can be students learning from multiple teachers. The group of teachers is, in turn, associated with many students.
You can use parts of speech to represent ER components, for example:
1. Primary key is often underlined to indicate that it uniquely identifies an entity.
_________
/ \
| Primary |
| Key |
\_________/
2. Foreign key links one entity to another
-----(Foreign key)------
3. Weak entity cannot exist without a related strong entity
Before we dive deeper into creating an entity-relationship diagram, it’s crucial to understand how they’re depicted.
An ERD can be depicted using three types of data models:
With this understanding, let’s go through the steps to help you create a relational data model.
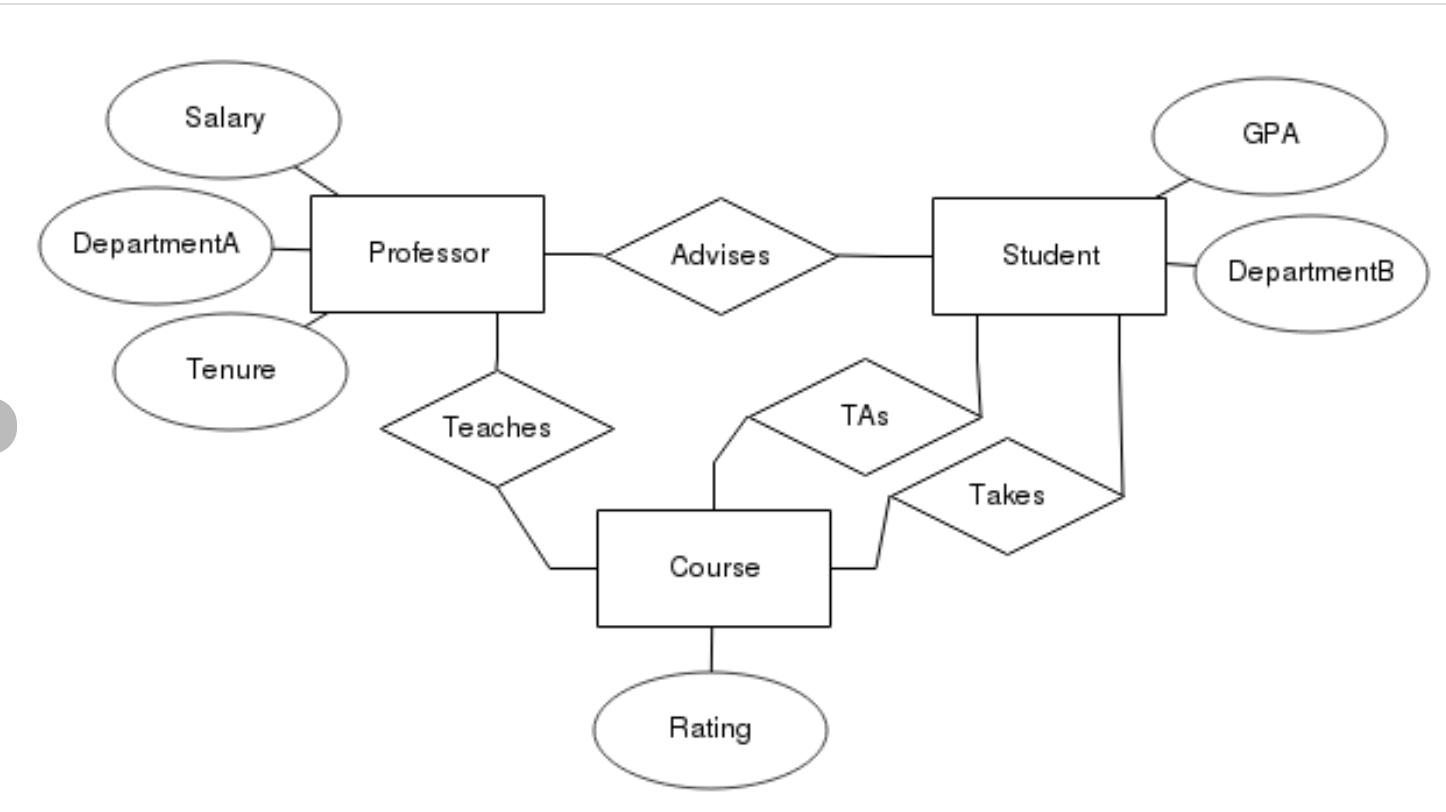
Here’s an example of an ERD to use as a reference.
Source: Research Gate
Below are some notable use cases of entity-relationship diagrams.
ERDs help model a database with logic and relevant business rules. These diagrams help project stakeholders understand the requirements for an information system and later help the team transform the design into a database.
For instance, imagine an airline wanting to model its booking system. The entities might include Flight, Passenger, and Ticket, and the relationships could describe how passengers book flight tickets. An ERD helps the development team understand how to structure these relationships before building the actual database.
Entity-relationship diagrams help engineers analyze an existing database and understand the relationships between entities and their attributes. When issues arise, these diagrams help engineers locate the root cause, facilitating quick resolution.
For example, if an e-commerce website is having issues with inventory management, an ERD helps engineers trace relationships between Products, Orders, and Suppliers to identify where the data flow is breaking down. Developers can quickly isolate and resolve the problem by pinpointing the entities and relationships.
These two are the primary use cases of the ERD. Additionally, ERD can be used to design business information systems or in business process re-engineering (BPR), where ERDs streamline the process of modeling or re-engineering an existing business information system.
Overall, ERDs are crucial for engineers when designing relational databases.
It's important to keep the following challenges in mind when working with an entity-relationship diagram.
When working with ERDs, it’s best to align with these practices to avoid rework or unnecessary back and forth with the team.
ERDs offer a clear way to visualize data. They make it easy to show what the database system would be like in terms of its architecture and get feedback from the team. This helps avoid any blunders that might come up later due to stakeholder misalignment or scope creep.
Moreover, visually planning the database structure helps remove bottlenecks that might emerge during development. It allows the development team to work more efficiently when no consistent firefighting is involved.
Ready to model your data and design databases? Check out different data modeling techniques that will help design reliable systems.


What is a relational database management system? A relational database management system...
 by Kelly Fiorini

Data remains an invaluable resource. When processed properly, it fuels savvy business...
by Sagar Joshi

What is a data breach? A data breach is an incident that exposes sensitive and confidential...
by Sagar Joshi